
ニュースレター
つながり続ける
ニュースレターで最新情報をお届けします!最新のソフトウェアリリースニュース、FEMFATを使用した最先端の疲労解析、エキサイティングなイベントやトレーニングのご案内、魅力的なケーススタディなどをお届けします。さらに、よくあるご質問にもお答えします。私たちと一緒に、卓越したエンジニアリングの世界を探求しましょう!
ニュースレターの購読
Newsletter 35/2025
Chip‑Crack Analysis: A Simulation‑Driven Approach for Reliable PCBA Design
Ensuring the mechanical robustness of printed circuit board assemblies (PCBAs) is becoming increasingly important as electronic systems face tighter packaging, higher power densities, and more demanding environmental loads. One critical failure mode in automotive electronics is the fracturing of sensitive components, particularly multilayer ceramic capacitors (MLCCs), caused by deformation of the PCB during assembly.
The Chip-Crack process presented in FEMFAT MELCOM introduces an efficient and automated workflow for predicting these chip‑crack zones at an early stage of development.
Understanding Chip‑Crack Mechanisms
Tolerance variations in the mounting points lead to PCB bending during assembly. These deformations generate localized strains on both sides of the PCB, which are directly transferred to the soldered components. MLCCs are especially susceptible to excessive strain, making early identification of components located in high‑risk regions essential. Standards like the IPC- or the AEC-Q-specification define the maximum bearable PCB-strain limits for such components.
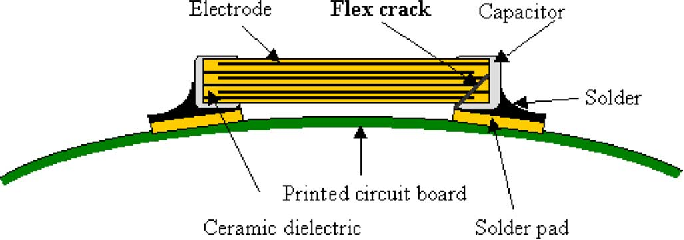
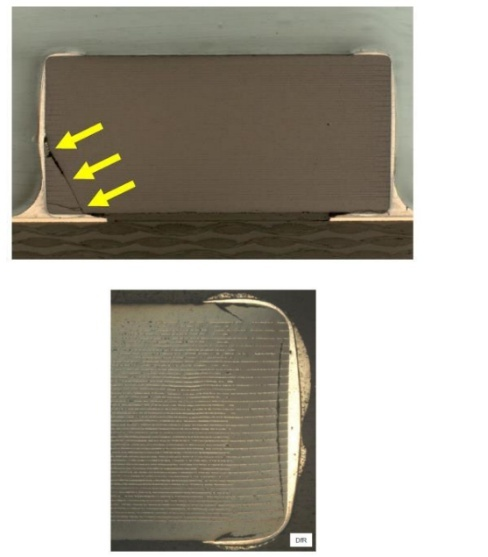
Figure 1 Cracks in MLCC due to PCB bending (Source: Isothermal aging effects on flex cracking of multilayer ceramic capacitors with standard and flexible terminations, Microelectronics Reliability Vol. 47, Issue 12; M. Keimasi, M. Azarian, M. Pecht & https://www.eptac.com/hubfs/EPTAC_February2022/pdf/eptac_09_17_14.pdf )
Finding the critical load can be a challenging task since PCBs are assembled via multiple mounting points where each follows a statistical distributed height tolerance. Therefore, the risk of chip‑crack cannot be evaluated with one single deterministic simulation alone. Instead, the considered load scenarios needed to be statistically distributed. The described process therefore uses a Monte Carlo approach to define randomly distributed tolerance samples which are calculated using a time-efficient calculation process based on superposition of linear elastic strain simulations for each single mounting point.
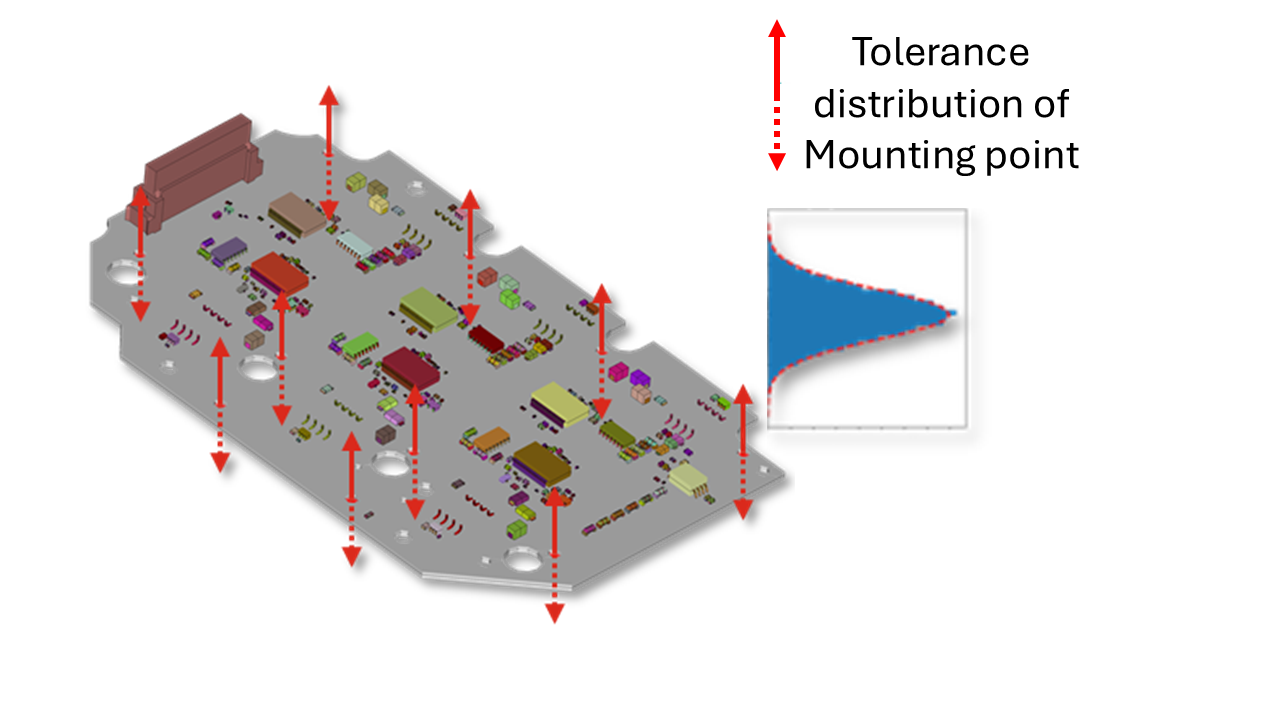
Figure 2 PCB with tolerances in the mounting points
Monte‑Carlo‑Based Simulation Approach
The core of the method is a Monte Carlo approach where thousands of statistically distributed tolerance combinations are considered. Analyzing these combinations directly in an FE solver would be highly time‑ and resource‑intensive. However, because tolerance‑induced displacements are typically small (less than 0.5 mm), the problem can be treated as linear.
To utilize this linearity, each mounting point is displaced by 1 mm in the normal PCB direction in separate FE calculation step, while all other mounting points stay fixed. This procedure delivers PCB-strain/displacement transfer functions for each single mounting point.
For every tolerance combination the overall resulting strain on the PCB can be obtained, by scaling and superposition the strains from the transfer functions with the respective tolerance values.
This approach allows the computation of the strain state for each tolerance combination outside an FE solver using simple matrix algebra. Therefore, it dramatically reduces computational effort compared to a direct evaluation of the tolerance samples.
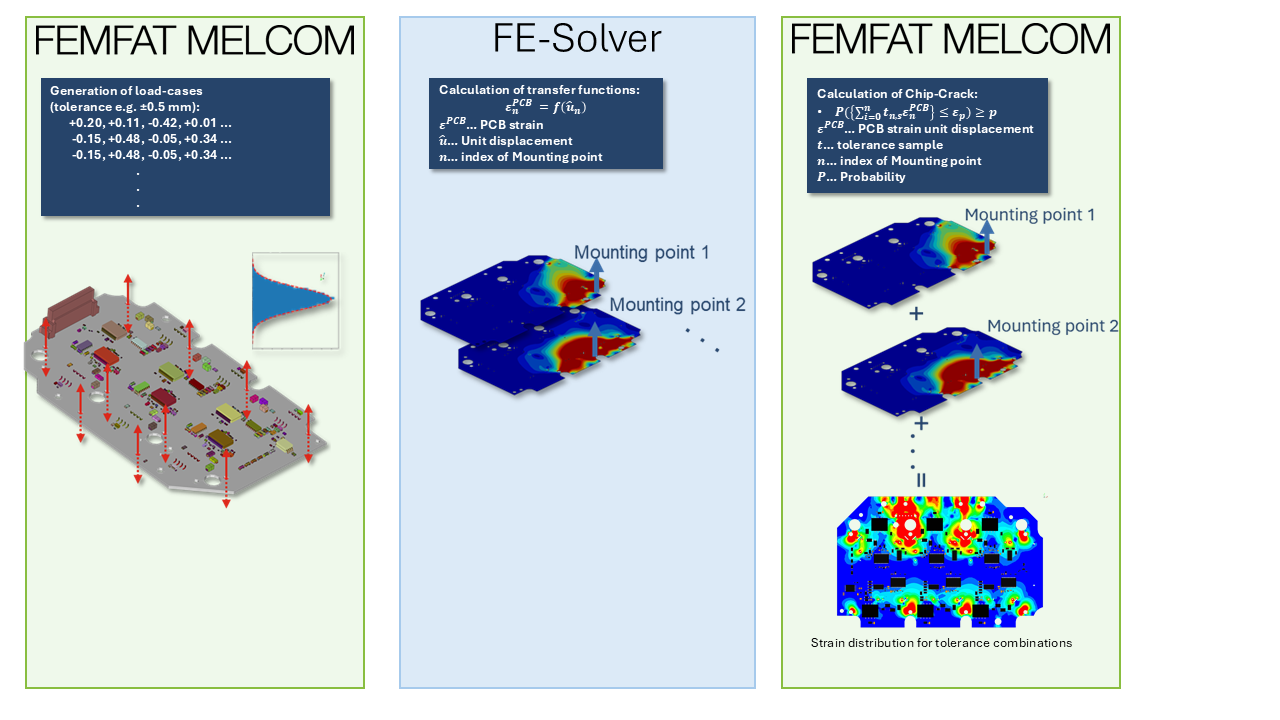
Figure 3 Calculation process for Chip-Crack
Quantifying Risk Through Strain Distribution Functions
For a meaningful evaluation of potential chip-crack zones it is necessary to evaluate not only the maximum strain values but also the probability of occurrence of these strains. From the results of all simulated tolerance combinations, the contour plot of PCB-strains for different probability limits can be investigated. Especially the strain exceeding a defined percentage of all tolerance cases (strain quantiles) can be calculated. E.g. 95 % quantile: Contourplot shows strain regiones exceeded in 5 % of the tolerance cases
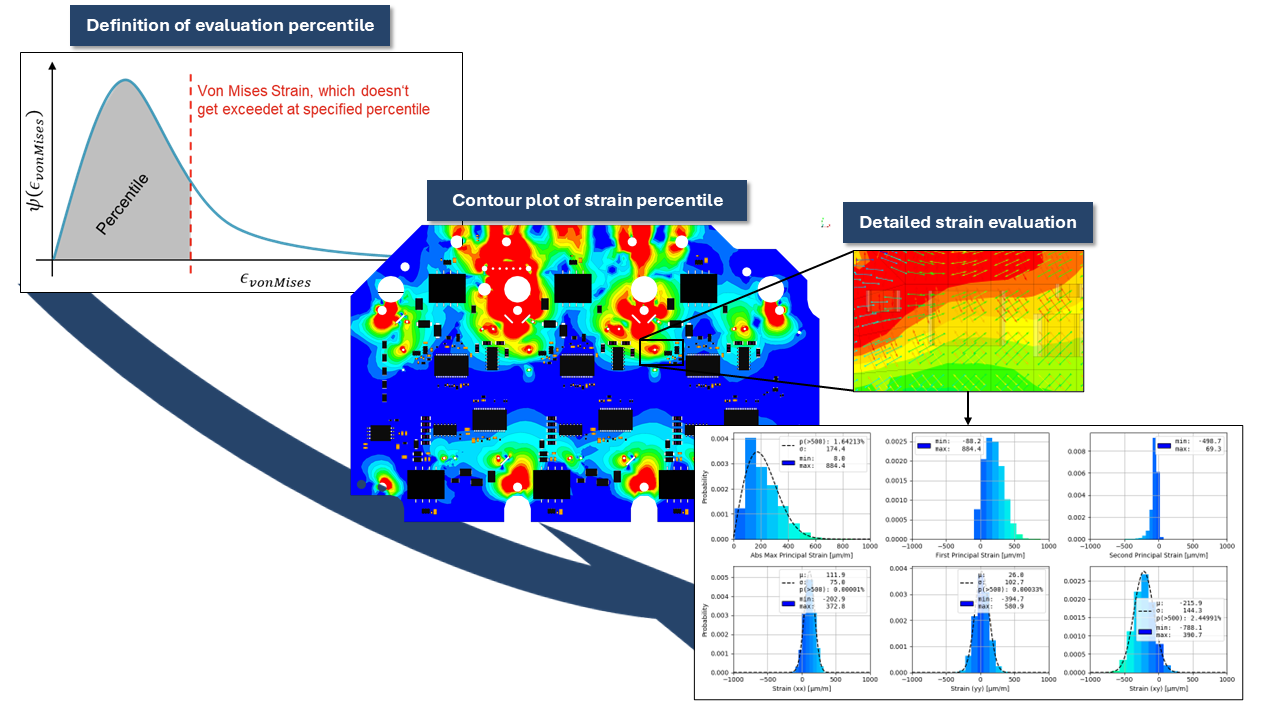
This provides an overview of the strain distribution on the PCB during assembly. If an SMD is located in a high strain area a detailed analysis can be done which exports the PCB-strain histograms from all calculated tolerance combinations. By fitting a probability density function based on these histograms, the strain can be evaluated further. By comparing these statistical strain levels to component‑specific limits (often based on IPC specifications) engineers can:
Identify zones where crack risk is elevated.
Evaluate the probability of occurrence that a strain limit would be exceeded.
If limit is exceeded: Decide whether a component must be moved or a reorientation is sufficient.
Measures like moving a component a few millimeters out of the high-strain zone or even changing the orientation of the component in normal direction to the highest principal strain can significantly reduce crack probability.
Benefits of the Automated Workflow
The described PCBA simulation process includes automated generation of FE‑models, integrated material homogenization, and efficient post‑processing. This automation is essential for handling the high problem complexity while keeping computation times practical.
Key advantages for engineering teams include:
Early detection of critical strain zones before prototypes exists
Statistically meaningful risk assessment instead of isolated worst‑case assumptions
Cost and time reduction by avoiding multiple physical test iterations
Improved design robustness through data‑driven component placement decisions
Conclusion
The chip‑crack analysis approach presented in the paper demonstrates how statistical FE‑simulation can greatly enhance the reliability of PCBAs. By combining Monte‑Carlo methods, linear superposition, and automated model generation, engineers gain a powerful tool for identifying and mitigating mechanical risks early in the development of PCBAs.
This methodology is now successfully applied in virtual validation workflows for automotive power electronics, helping engineers to build more reliable hardware and streamline development cycles.
Release News FEMFAT 2026
The new FEMFAT 2026 release is here: faster, smarter, and packed with improvements. Below you’ll find a compact overview of the most exciting innovations that are sure to make your daily work smoother and more efficient.
Massive Performance Gains
Up to 10× Faster ChannelMAX Scratching
ChannelMAX now supports multi‑CPU scratching leading to massive speed‑ups with up to 10× faster scratch operations on real customer models.
Huge Acceleration for SPECTRAL + WELD
A redesigned notch factor estimation drastically reduces computation time, especially for models with many modes.
Example: A 1000‑mode model now completes in ~10% of the previous runtime.
New VISUALIZER Capabilities
MP4 Export of Stress Animations
You can now export stress animations directly from the VISUALIZER as MP4 videos with adjustable quality and frame rate.
Perfect for reports, presentations, and documentation.
Node‑Based Result Export (CSV)
A new export button lets you save selected node results (based on configured subwindows) into a structured CSV.
Includes detailed position information, result availability flags, and sorting, ideal for further post‑processing.
Smarter Model Handling & Automation
Improved Stress Format Assignment
When no stress file is specified, the selected stress format is now automatically applied to all table rows removing repetitive manual adjustments.
Enhanced HEAT Node Filtering
New options allow filtering between surface nodes and all nodes, giving cleaner, more targeted thermal evaluations.
SolidWELD “Complete” Function Upgraded
The group “Complete” function now automatically collects all relevant nodes and elements needed for SolidWELD analysis significantly reducing pre‑processing time.
Major Improvements in WELD Processing
New *.wdf and *.fss File Formats
A major modernization of weld data formats brings:
Precise mapping of MAT‑labels per segment
No more mis‑detected seam intersections
Correct handling of multi‑segment and overlapping welds
Enhanced stress‑correction logic using segment‑aware neighbor searches
The old format remains readable.
Better Handling of Weld Intersections
Multiple long‑standing issues (extra elements, incorrect MAT‑labels) are now eliminated thanks to revised geometry recognition and direct WELD‑data import.
Advanced Statistical Fatigue Handling
A revised statistical framework now provides:
Definition of material range of dispersion, i.e. on specimen level, independent of range of dispersion definition on component level (done in the “Node Characteristics” menu)
Full integration across BASIC, MAX, WELD, LAMINATE, SPECTRAL, etc.
Material Range of Dispersion Now in All *.ffd Files
All material files now include a “range of dispersion” parameter, with special values for polymer classes and short‑fiber reinforced plastics.
Polymer Material Generator: Refreshed & More Intuitive
The polymer material generator has been redesigned with a clearer layout, improved input validation, and editable material data.
Visual previews show how changes to UTS, YTS, PTS, or ATS affect all relevant parameters.
DMA Export: Now Beyond 6 Results
The DMA system has been fully rebuilt:
Export any number of results (no longer capped at 6)
New, cleaner GUI
Smarter default behavior per module
Powerful right‑click table operations (insert, move, replace, delete)
Supports OP2, ODB, RST, H3D, and more.
Additional Quality‑of‑Life Improvements
License timeout in VISUALIZER to free tokens automatically
More robust startup parameter checks
Updated DVS 1608 (2022) method in WELD
Cleaner groups creation logic for node colours and MAT‑ID
Improved polymer input checks (invalid fiber portion warnings)
FEMFAT 2026: a Release Focused on Real Productivity Gains
This year’s release puts strong emphasis on speed, robustness, and usability. Whether you're running complex ChannelMAX simulations, preparing data for documentation, or working with advanced materials, FEMFAT 2026 brings noticeable, tangible improvements to your workflow.
Release News FEMFAT inside Ansys Extension
We are pleased to introduce the new release FEMFAT inside Ansys Extension 4.13 (FFiA 4.13).
This version adds support for the latest ANSYS 2026 R1 and FEMFAT 2026, ensuring seamless compatibility with current simulation environments and improved integration. https://magna-my.sharepoint.com/personal/gerhard_spindelberger_magna_com/Documents/Microsoft Copilot-Chatdateien/FFiA-4.13_Release_Notes.pdf
Key highlights include significant enhancements in result evaluation, with more than 60 new result objects and extended Detailed Results visualization in SN curves and Haigh diagrams. In addition, a new output control functionality allows users to precisely define which results are written to the output files. https://magna-my.sharepoint.com/personal/gerhard_spindelberger_magna_com/Documents/Microsoft Copilot-Chatdateien/FFiA-4.13_Release_Notes.pdf
User productivity has also been improved with new template features for saving and reusing analysis setups, as well as additional material generators for modern materials such as magnesium alloys and polymers. https://magna-my.sharepoint.com/personal/gerhard_spindelberger_magna_com/Documents/Microsoft Copilot-Chatdateien/FFiA-4.13_Release_Notes.pdf
Alongside these new features, multiple bug fixes and stability improvements have been implemented, further enhancing the robustness of the analysis workflow and GUI performance.
The new extension is now available for download on our website:
femfat.magna.com/download/femfat-software-and-release-notes
Upgrade now and take your fatigue analysis to the next level.
VISUALIZER Highlights in FEMFAT 2026
The FEMFAT visualizer continues to become more powerful, intuitive, and essential for everyday fatigue evaluation. In this release, several features deliver real, practical efficiency gains, especially when working with weld definitions, reporting, and documentation.
Smart Report Export (New!)
The new Report Export lets you create compact, analysis‑ready CSV files directly from the VISUALIZER.
With one click, you can export:
The nodes currently active in the 3D view
All values configured in the Subwindow setup (including TOP/BOTTOM/CRIT positions, weld root/toe info, laminate layers, SPOT details …)
Node states such as Not Analysed, and test course distances when applicable
Clear naming and semicolon‑separated formatting for smooth Excel or script‑based post‑processing
This transforms the VISUALIZER into a convenient reporting companion — no more manual copying, no more screenshots of numbers.
XMCF Export — Geometry‑based Weld Definitions for Variant‑Safe Workflows (Major Benefit!)
Traditionally, weld definitions in FEMFAT rely on the WDF file, which is mesh‑based.
That means:
The weld definition depends on FE mesh node and element numbers
If the mesh changes (design variant, mesh refinement, CAD update …),
→ all weld seams must be redefined from scratch
Even tiny changes in numbering break the weld mapping
This is time‑consuming, error‑prone, and discourages iterative design.
With the XMCF Export, FEMFAT eliminates this limitation.
XMCF is geometry‑based, not mesh‑based.
It stores weld seams by their geometric position in space, independent of the actual FE node/element numbering.
The workflow becomes dramatically more powerful:
Define weld seams once
For example using the automatic Weld Seam Scanner or manually in the VISUALIZER.
Export as XMCF
This captures the geometric definition of all seams.
For a new mesh variant (new element sizes, new numbering …), simply:
→ Import the XMCF file again.
As long as the weld’s geometric location has not changed,
the VISUALIZER can directly regenerate a correct WDF file for FEMFAT — automatically.
No redefinition, manual checking or loss of information necessary any more.
What this means in practice:
Perfect for design iterations
Perfect for supplier meshes
Perfect for automated meshing workflows
Perfect for situations where geometry stays, but the FE model changes
Saves hours to days of repeated weld work
Ensures consistency across variants
Additional advantages (from the VISUALIZER’s XMCF workflow):
XMCF files can also be combined with manually defined seams
The VISUALIZER displays successful vs. failed seam mappings and highlights mismatches
Multiple XMCF files can be imported simultaneously
Assignments can be stored and reused via .xat mapping files
With XMCF Export, FEMFAT introduces a truly robust, future‑proof weld definition methodology.
Faster Min/Max & Local Hotspot Search
Visualizing critical points becomes simpler with improved Min/Max tools:
Search minima or maxima in any user-selected area
Includes volume elements and internal nodes
Identical extrema are highlighted simultaneously
Fully compatible with element/PID visibility filters
Optional “Local Extrema in Areas” mode for targeted hotspot detection
This accelerates root‑cause analysis and removes many tedious scanning steps.
📸 Drag‑and‑Drop Screenshots for Instant Documentation
Documentation has never been faster: simply drag a screenshot from the 3D window into PowerPoint, Word, Outlook or Explorer.
Instant snapshot
Automatically numbered PNG creation when holding Shift
No dialogs, no browsing, no file‑naming required
Perfect for quick design reviews, customer discussions, or internal reporting.
Bonus: A Few Hidden Gems You Might Not Want to Miss
Colorbar “Critical View” Filtering
With Below/Above Range modes, you can fade out everything outside your focus area, perfect for quickly spotting critical hotspots in large models.
ChannelMAX Stress Visualization with Sorting
When evaluating multi-channel load cases, you can display factor‑scaled stresses per channel, automatically sorted by magnitude, ideal for understanding dominant load contributors.
User‑defined Views Stored in curview.xml
Personalized camera views (including rotation center) persist between sessions, making consistent documentation incredibly easy.
FEMFAT visualizer 2026: Smarter. Faster. Variant‑Proof.
This year’s VISUALIZER features deliver real-world benefits for engineers working under time pressure:
Report Export: fast, structured documentation
XMCF Export: variant‑safe weld definitions: define once, reuse forever
Min/Max Tools: quick hotspot detection
Drag‑and‑Drop Screenshots: instant communication
FEMFAT 2026: Improved Statistical Influence
The fatigue life of metallic and polymer components is inherently subject to scatter in both material and structural behavior. FEMFAT traditionally accounts for this reality by introducing a statistical influence based on a log-normal distribution of fatigue strength.
Why Statistics in FEMFAT? Theoretical Background
Fatigue strength cannot be treated as a deterministic value. Instead, it follows a statistical distribution derived from experimental data (specimen S/N curves).
The log-normal distribution is described by:
Mean value m of the logarithmic fatigue strength
the standard deviation s, or alternatively by the range of dispersion TS, with
