ニュースレター
つながり続ける
ニュースレターで最新情報をお届けします!最新のソフトウェアリリースニュース、FEMFATを使用した最先端の疲労解析、エキサイティングなイベントやトレーニングのご案内、魅力的なケーススタディなどをお届けします。さらに、よくあるご質問にもお答えします。私たちと一緒に、卓越したエンジニアリングの世界を探求しましょう!
ニュースレターの購読
Newsletter 28/2019
Endurance Safety and associated Probability of Failure; FAQ 1, 2 & 3
Endurance Safety and associated Probability of Failure
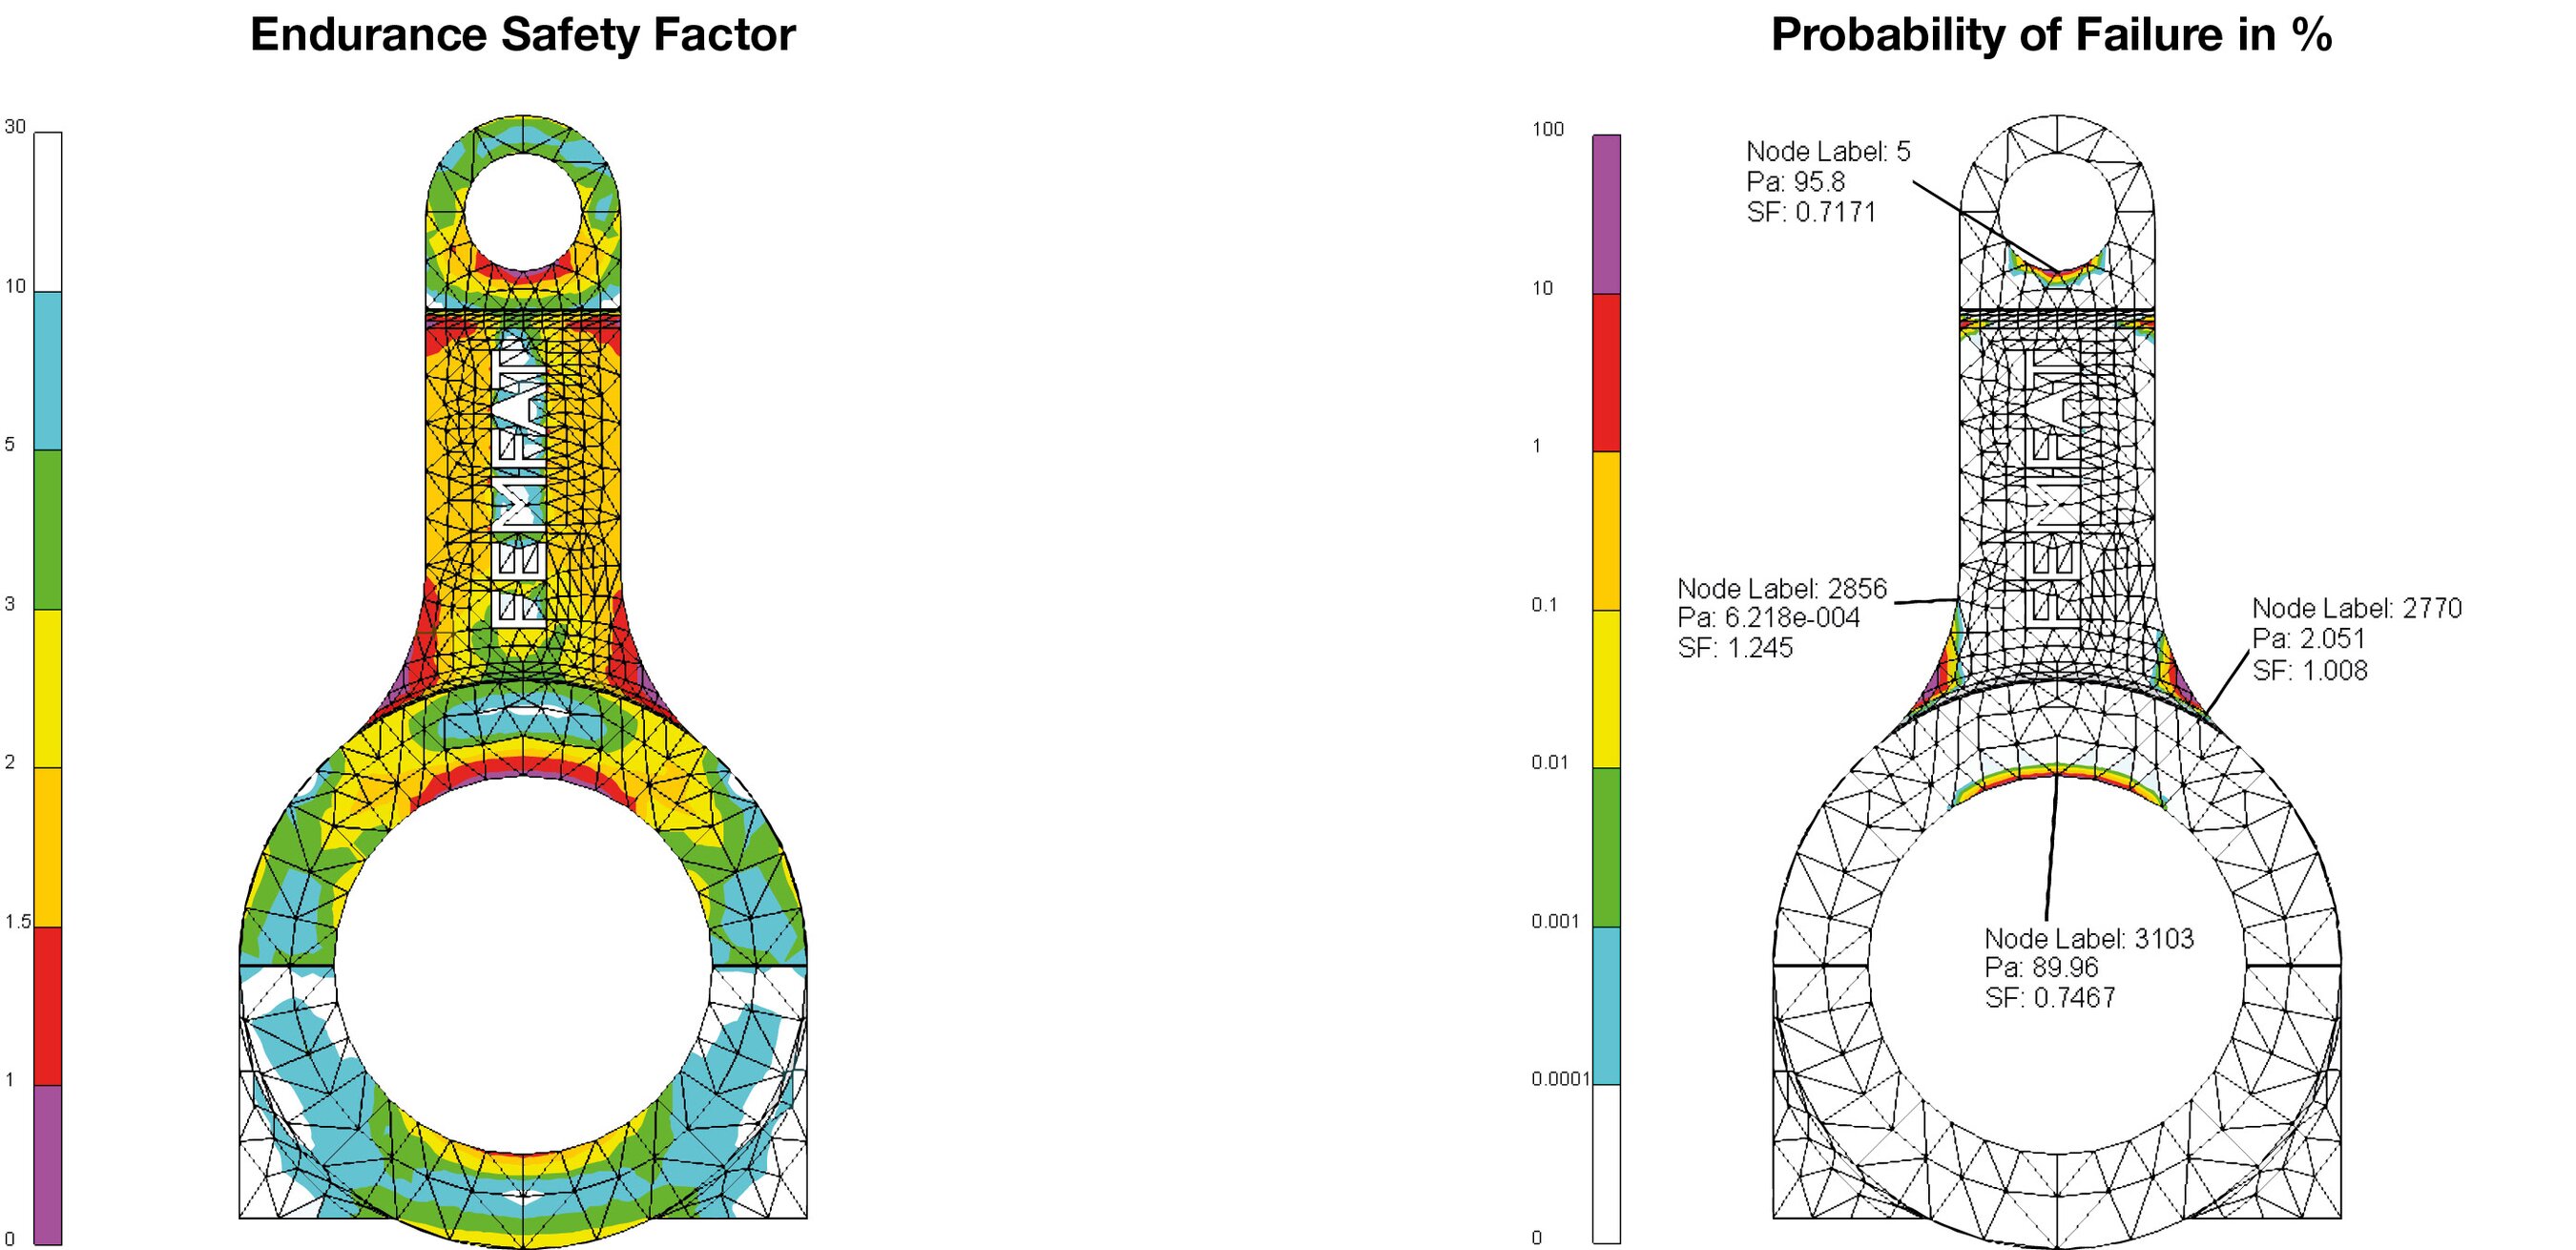
In an endurance safety factor analysis, the safety factor SF is defined as the quotient of the local fatigue strength σD and the locally occurring stress amplitude σA: SF = σD / σA
What does a safety factor of 1 mean? First of all, that the sustainable amplitude is completely exhausted. For a further (statistical) interpretation, the survival probability pü of the S/N curve is taken into account: in 100 * pü% of cases, the load can be sustained, in 100*(1-pü)% not. For example, with the 97.5% survival probability typical of the FKM guideline, this means that out of 1000 parts, 975 hold, 25 not. In the real application, however, one will demand significantly higher survival probabilities. To take account of the desired / required survival probability, the statistical influence factor can be activated in FEMFAT. Now, how is a node with safety other than 1 different in terms of survival probability?
Some Theory:
To answer this question, we need some tools from probability theory, which are summarized below.

According to Haibach, the probability of failure pA is calculated for logarithmically normally distributed stress amplitudes using the cumulative distribution function Φ(u) of the standard normal distribution

A typical measure of variability - especially in mechanical engineering - is the range of dispersion TS. The range of dispersion is defined as the ratio of component fatigue strength at 10% probability of survival and component fatigue strength at 90% probability of survival.
The range of dispersion can be specified in FEMFAT in the node characteristics menu and corresponds by default to the value recommended by Haibach of 1.26.
For the conversion to other survival probabilities the statistical influencing factor fstat is calculated in FEMFAT. The value (1/fstat) is used for the scaling of the local endurance limit.
With the initial survival probability (the material S/N curve) pü1, the corresponding fatigue strength value of the specimen σD, specimen and the fatigue strength value with desired survival probability pü2 we get with the respective quantiles ucomponent and uspecimen:

FAQ 1: What should be considered when using the user-defined temperature influence?
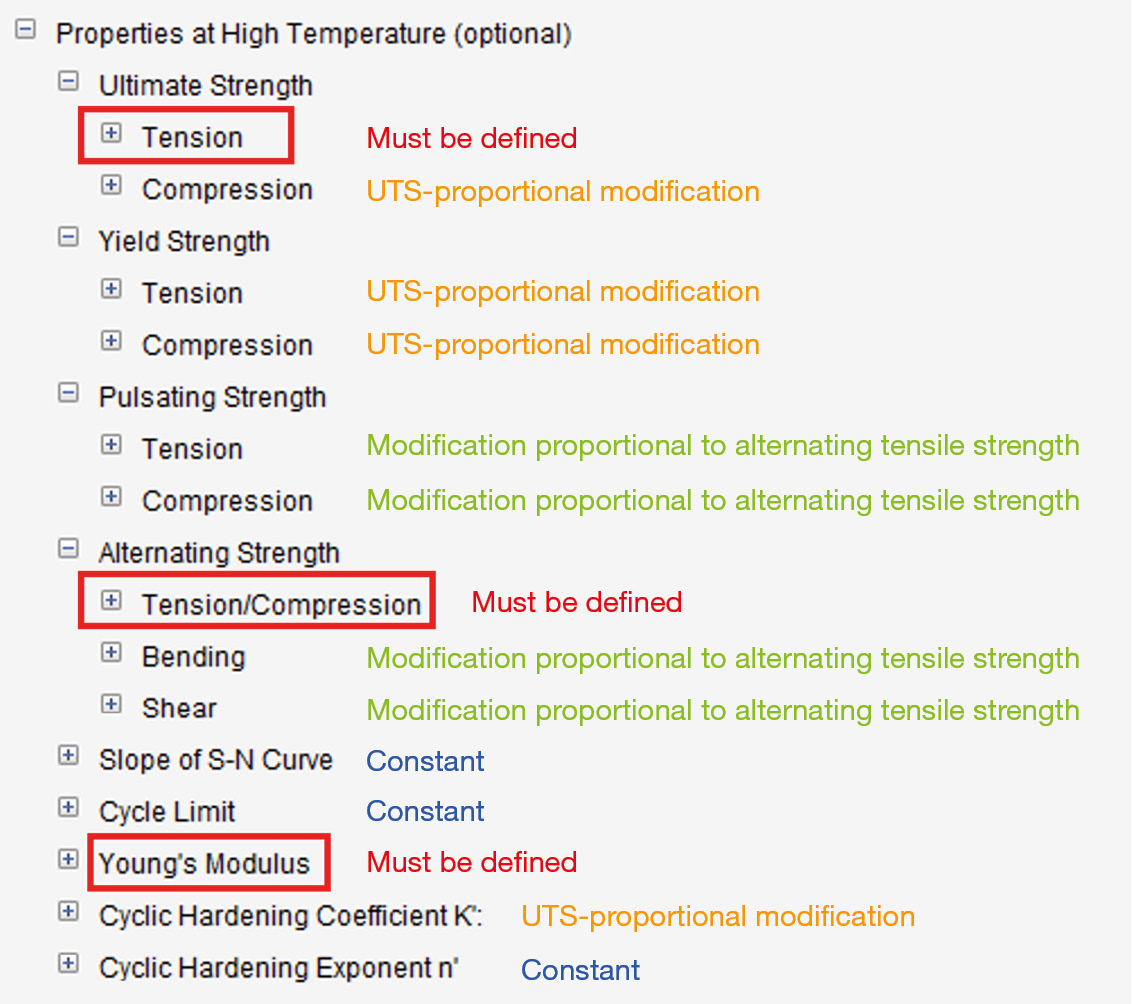
In many applications, elevated temperatures occur. In order to take these into account in the fatigue analysis, the isothermal temperature must first be specified in the node characteristics menu, either as constant value or as temperature distribution from FEA. In the next step, the influence factor „Isothermal temperature influence“ has to be activated. By default, the strength values are then reduced according to the „FEMFAT 4.6“ method based on the FKM guideline. In addition, FEMFAT offers the possibility to specify the material behavior at higher temperatures. The temperature-dependent behavior can be specified not only for the static and dynamic strength values but also for the S/N curve parameters, the Young‘s modulus and the cyclic hardening coefficient or exponent.
However, despite all flexibility, it should be noted that not all of these input options are mandatory. The minimum requirement for using the user-defined temperature influence is the specification of the temperature-dependent values for the Young‘s modulus as well as ultimate tensile strength and alternating tensile / compressive strength. The remaining strength data are then – if not specified – automatically reduced proportionally to these values or kept constant, cp. also the following picture.

FAQ 2: What options does FEMFAT offer for postprocessing?
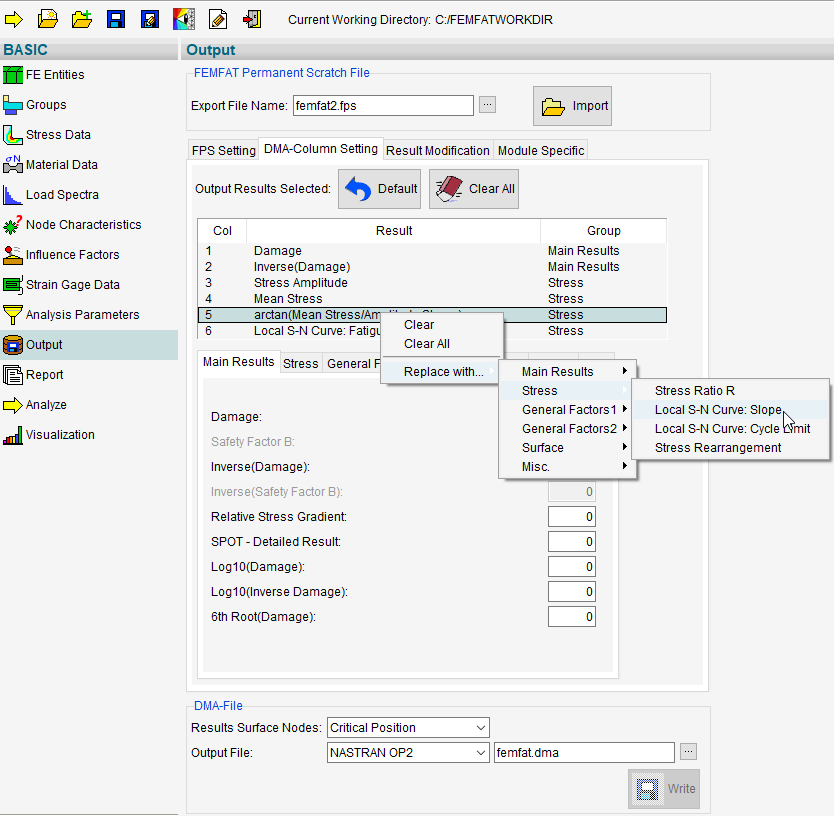
The results of a successful FEMFAT analysis are written to the binary „Permanent Scratch“ file (fps file). This file can be opened with the VISUALIZER and used for the evaluation of the fatigue results. All functionalities are available that can be expected from a modern postprocessor. Particularly profitable the VISUALIZER can be used in the interpretation of results, because all requested detail results (over 50) are available at once. Alternatively, you can export the FEMFAT results to a dma result file for other postprocessor programs. Since for most interfaces this export must take place in the form of a displacement vector, a maximum of six results are available. The selection of the desired detailed results is done in the menu „Output“ in the tab „DMA-Column Setting“ by unambiguous assignment of a column number from one to six. This selection can be made especially conveniently with a right mouse click (see figure).
Tip: The output of FEMFAT results in a dma file is also possible after completion of the FEMFAT session. All you need is the fps file with the results you would like to export. Start FEMFAT and go directly to the „Output“ menu. Use the „Import“ button there to read in the fps file. Then you can select the desired results as well as the interface and export the results by pressing the „Write“ button.
Note: the Abaqus interface requires a previous model import (odb file) from the “FE Entities” menu.

FAQ 3: Why is „Not Analysed“ displayed in the results display for weld nodes in VISUALIZER for individual result positions?
For the output and display of results at weld nodes, there are three result positions available in the VISUALIZER:
- Visualization of the analysis results as a middle or end node,
- Visualization of the results at the weld root or at the weld toe,
- Visualization of the results of the individual stress components (Normal stress perpendicular to and parallel to weld, Shear stress, Equivalent stress).
Basically, the critical values for each of the three categories are first displayed when invoking the results. The user-defined selection of the evaluation positions can be made via a drop-down menu.

However, it should be noted that all results for root & toe are not available for all involved sheets / elements at one weld seam node. Only those weld toes and roots are calculated for which notch factors have been defined in the WELD database. The values of the most critical element are then displayed according to the settings.
This means, for example, that if the critical element has no weld toe at all (because it lies on the side away from the seam like an element of type 202, pictured right), then the value is also not available. In VISUALIZER, when „Toe“ is selected for such a weld node, „Not Analysed“ is displayed, cp. the example of a T-joint below.
BACK TO OVERVIEW
